A CFO cockpit over a group that closed its books separately
Hospitality and real estate
A hospitality and real estate group whose entities each closed their own books. The group close now runs from one validated cockpit that refreshes overnight.
Each division closed its own books, so group controlling spent the first week after month-end merging workbooks by hand. The CFO now signs the group close from one cockpit, validated cell by cell and refreshed overnight.
BI consumers across controlling, accounting and the board
production capacity, held through modelling discipline
F2
front-ends on one model: Power BI and Excel
2
Anonymised by sector and size. Sector and outcomes are real; identifying detail is not. What the engagement moved in hours and headcount is not published here, because nothing we could point to would let you check it.
Before and after
A week of Excel
3 divisions send workbooksEach on its own rhythm, with its own reading of margin, EBITDA and forecast
Group controlling merges by handReconciling rather than analysing
The CFO sees the group P&LOnce the month is already history
Overnight
Division systems load overnightFabric pipelines, with no workbooks passed around
One validated Finance modelEvery cell reconciled to source before close
The CFO cockpitYesterday’s numbers first thing in the morning
From a week of manual Excel consolidation to one cockpit that refreshes overnight.
The engagement in full
Client
A family-owned Central European group of 250 to 500 people in 3 divisions, Corporate, Real Estate and Hospitality, with several operating companies, multiple currencies and management and statutory ledgers side by side.
Situation
The review found reporting fragmented across systems that had grown up separately, so consolidation happened in spreadsheets, by hand, by people who were good at it and could not be replaced. Nobody owned the definitions that were meant to tie the entities together.
Mandate
Introduce Microsoft Fabric from scratch and build one performance cockpit as the group’s single source of truth for month-end close.
What we built
FoundationA review of the group’s reporting that showed where each entity’s figures parted ways and ended in a fix-first list.
ActivationA ten-month rollout that replaced the spreadsheets with a governed platform, and a CFO cockpit on top of it that consolidates every entity on shared definitions.
The capacity tier that was not bought
In the first rollout, the most common filter combinations pushed the model against the memory limit of the entry-level capacity. The usual answer is a larger tier, and each step up doubles the capacity bill. We measured where the load came from instead, rebuilt the one calculation causing it, and the cockpit stayed on F2. This is written into the client agreement: capacity is scaled only once the optimisation paths are exhausted and the data volume genuinely outgrows the tier.
The cockpit the close is signed from
Group P&L down to EBT with the 3 divisions side by side, KPI cards across actual, budget, forecast and prior year, a ledger switch between management and statutory, and a drivers panel on every page.
Three models, not one monolith
Finance carries P&L to EBT, contribution margin, actual against budget, forecast and prior year, the ledger switch and consolidation. Operational carries occupancy, RevPAR and the operating metrics of the hospitality arm, with property KPIs on the real estate side. Executive is a condensed board view that references both rather than restating them. Each model carries its own KPI definitions, time intelligence with a cut-off for closed periods, scenario logic and security, so a defect in one domain does not take down the reporting layer and teams deliver in parallel.
How the model stayed on F2
The cause was located and fixed before any tier was bought.
Filters hit the limitOn entry-level capacity, in the first rollout
Cause measuredOne calculation, not the data volume
Calculation rebuiltOne path per cell instead of every branch
F2 staysUnder a second, across 4 scenarios
How the work was run
Validation first: Finance signs the reconciliation of every cell, not the report.
Overnight refreshSources into the Finance model
Cells reconciledEvery cockpit cell against source
Finance signsThe validation file, not the report
Close on the cockpitNo Excel cross-checks
One model, two front-ends
The same model reaches the CFO in Power BI and the controllers in Excel.
Power BI cockpitThe group view for the CFO and the board
Finance semantic modelMargin, EBITDA and variance, defined once
Excel pivotsAnalyze in Excel, for the controllers
Target architecture
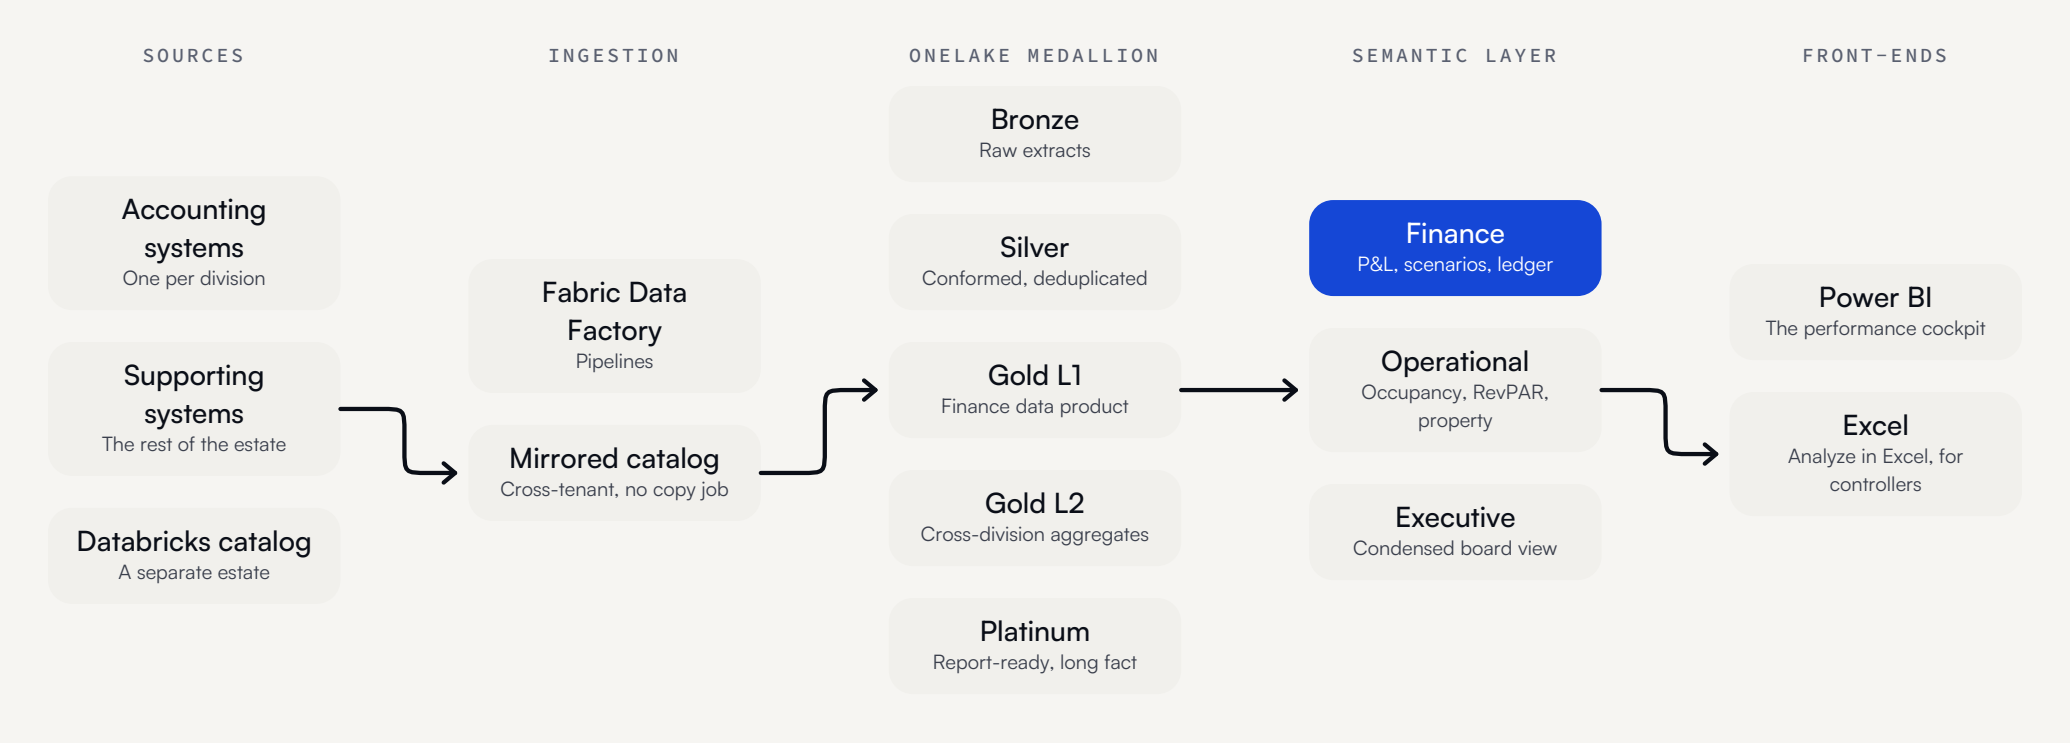
Sources into Fabric ingestion, a medallion lakehouse in OneLake, 3 semantic models read over Direct Lake, and the 2 front-ends on them. Finance is the model the close is signed from.
What the client has today
Month-end close signed from the cockpit, on a cell-level validation file rather than a set of linked workbooks.
A group close that takes one validated overnight run rather than a week of Excel work after month-end.
A group model across 4 scenarios that renders in under a second on F2, held there by modelling discipline rather than a capacity upgrade.
Direct Lake on a mirrored catalog, with no copies and no nightly import refresh.
Self-service across Corporate, Real Estate and Hospitality at division and entity level, without central controlling in between.
One model behind both the Power BI cockpit and the controllers’ Excel pivots.
A foundation that forecasting, Copilot questions and AI commentary on variances attach to without re-architecting.
For your IT team
The decisions behind the cockpit, for the people who would run something like it. Every major decision was agreed in a workshop with the head of data and analytics and the data engineering lead before it was built.
Three domain tiers and one reporting workspace, each in DEV, TEST and PROD, with production reached only through an approval gate. There is deliberately no workspace per division: the separation between Corporate, Real Estate and Hospitality runs through row-level security inside the model rather than through parallel workspaces, which keeps the topology small, the CI/CD chain traceable and the lineage readable.
Power BI project files under Git from day one, promoted through a Fabric deployment pipeline from DEV to TEST, with a manual sign-off before production.
Bronze holds raw extracts versioned per source system and Silver the typed, deduplicated layer with conformed account, entity and time dimensions and the ledger flag carried separately. Gold L1 is the finance data product and is owned by group controlling rather than the data team; Gold L2 holds cross-divisional aggregates and Platinum the report-ready long facts, so KPI dispatch resolves through calculation groups.
The F2 limit was solved by replacing one SWITCH measure for KPI dispatch with a calculation group over a bridge table. Before, every branch was evaluated for every cell and common slicer combinations hit the query memory limit; after, the engine resolves one path per cell and the model renders sub-second across 4 scenarios on F2.
Row-level security roles run against the 3 divisions, with members as Entra security groups, so onboarding a divisional controller is a group assignment rather than a model change. A ledger role sits across all of them, separating management from statutory, and the time-boxed break-the-glass roles for month-end are audited on a regular cadence rather than left open.
Purview sensitivity labels on the finance assets, with the operating companies’ P&L data at the highest level in use. Dynamic data masking on salary-adjacent HR columns in the controlling warehouse, unmasked for a narrow finance circle only and always on top of column-level security. Workspace identity, a service principal and Azure Key Vault for the platform’s credentials.
Where it left them
One number per metric, arrived at the same way in every entity, and a group close that takes one validated overnight run rather than a week of manual work.
A retailer with Microsoft Fabric already in production, semantic models over Direct Lake and store revenue streaming in, who wanted forecasting, Copilot questions and anomaly detection on top of it.