Case study

Finance and sales reporting, moved off legacy SQL and Excel

Telecommunications

A telecommunications company whose enterprise reporting ran on legacy SQL and Excel. Finance and sales now report from one central model on a governed data platform.

Read the engagement brief(opens in a new tab)
Period
7 months
Company
250–500 people
Focus
Finance and sales
A schematic: the separate reports this engagement started from, the one consolidated reporting layer that replaced them, and the technologies underneath.

Legacy SQL and Excel, replaced by one central model

Finance and sales reporting had been built on legacy SQL and Excel, report by report. We moved it onto a governed platform with one central model and gave the in-house BI team the patterns to build on it.
central reporting model
1
business areas: finance, sales
2
months of engagement
7

No outcome figures are published for this engagement: nothing exists that would let you check them, so what was built is described in full instead. Anonymised by sector and size, because the confidentiality that protects this client would protect you too. Sector and outcomes are real; identifying detail is not.

Before and after

Before and after the engagement

Report by report

  • Legacy SQL and Excel, report by reportLogic written again for each report
  • Finance and sales apartNo shared reporting model

One central model

  • Pipelines into one central modelOn a governed data platform
  • Reusable patterns and templatesConsistent, maintainable reports
From reporting rebuilt on legacy SQL and Excel to one central model that finance and sales share.

The engagement in full

Client
A telecommunications company of 250 to 500 people.
Situation
The logic behind each report was written again for the next one, and finance and sales shared no reporting model, so the same question asked in two departments could be answered two ways without either being wrong.
Mandate
Consolidate enterprise reporting from legacy SQL and Excel onto a governed data platform for finance and sales, and leave the in-house BI team able to run it.

Built to be maintained

Patterns, templates and workshops keep the reporting consistent after handover.

  1. Reusable DAX patternsWritten once, used across reports
  2. Power BI templatesOne layout and navigation
  3. Adoption workshopsFor the in-house BI team
  4. Consistent, maintainable reportingRun by the client’s own BI team

The architecture

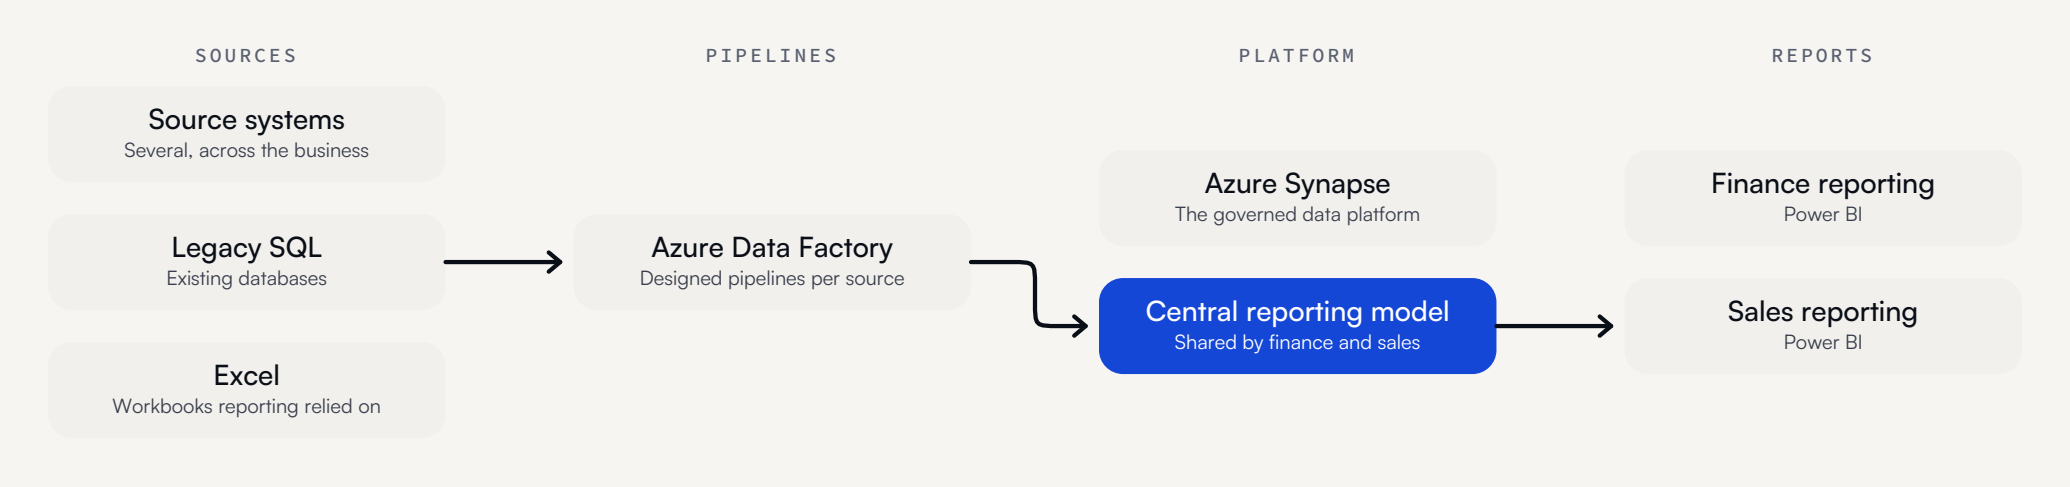
Sources: Source systems · Legacy SQL · Excel. Pipelines: Azure Data Factory. Platform: Azure Synapse · Central reporting model. Reports: Finance reporting · Sales reporting
Each source loads through designed pipelines onto the governed platform, where one central model serves both finance and sales.

Architecture decisions

DecisionRejected alternativeWhy
One central reporting modelA model per departmentFinance and sales read the same figures from one place.
Designed pipelines per sourceExtracts maintained by handLoads are repeatable and can be monitored.
Reusable DAX patternsLogic written per reportA calculation is written and tested once, then reused.
Power BI templatesEach report laid out from scratchReports look and behave the same, which keeps them maintainable.

What the client has today

  • Enterprise reporting for finance and sales on a governed data platform instead of legacy SQL and Excel.
  • Designed pipelines from multiple source systems into one central reporting model.
  • Reusable DAX patterns and Power BI templates for consistent, maintainable reports.
  • An in-house BI team trained on the platform through adoption workshops.
Where it left them
Finance and sales work from one central model, and the team that maintains it was trained on the same patterns it was built with.
Stack
  • Power BI
  • DAX
  • SQL
  • Azure Data Factory
  • Azure Synapse
All case studies

The other engagements

  • Retail

    Foundation then Activation then Acceleration alongside Stewardship

    Store revenue, executive questions and forecasting on one set of definitions

    A retailer with Microsoft Fabric already in production, semantic models over Direct Lake and store revenue streaming in, who wanted forecasting, Copilot questions and anomaly detection on top of it.

    • Microsoft Fabric
    • Power BI semantic models
    • Direct Lake
    • Copilot in Power BI
    • Fabric AI Functions
    • Activator
  • Industrial manufacturing

    Foundation then Activation then Acceleration

    Governed reporting across a production network

    An industrial manufacturer reporting across a production network of sites, each with its own view of what was running.

    • Microsoft Fabric
    • OneLake
    • OneLake Security
    • Direct Lake
    • Spark
    • MES
    • OPC UA
    • Power BI
    • DAX
    • Azure Key Vault
    • Purview
    • Azure DevOps
  • Hospitality and real estate

    Foundation then Activation

    A CFO cockpit over a group that closed its books separately

    A holding group across hospitality and real estate, with entities that each closed their own books and a CFO who had to answer for all of them.

    • Microsoft Fabric
    • OneLake
    • Direct Lake
    • Databricks Mirrored Catalog
    • Fabric Data Factory
    • Power BI
    • DAX
    • Calculation groups
    • Row-level security
    • Azure DevOps
    • Azure Key Vault
    • Purview
  • Multi-brand retail

    Foundation then Activation

    One governed model across a multi-brand retail group

    A retail group running several brands, each with its own systems, its own reporting habits and its own answer to what a margin is.

    • Microsoft Fabric
    • Direct Lake
    • Databricks
    • Eventstream
    • KQL Database
    • Power BI
    • DAX
    • SAP
    • Salesforce
    • Azure DevOps
All case studies

Free consultation

Know where your data stands in an hour.

A free 60-minute consultation. No pitch, no invoice. You’ll leave knowing whether your data is ready for AI, and whether we’re a good fit.

Book your free consultation(opens in a new tab)