From usage to action
Usage data Behaviour dashboards Churn monitoring Action
Case study
Internet and IT
An internet company whose customer data was spread across business units. It now sits in one Snowflake warehouse, with dashboards that monitor usage and churn.
Read the engagement brief(opens in a new tab)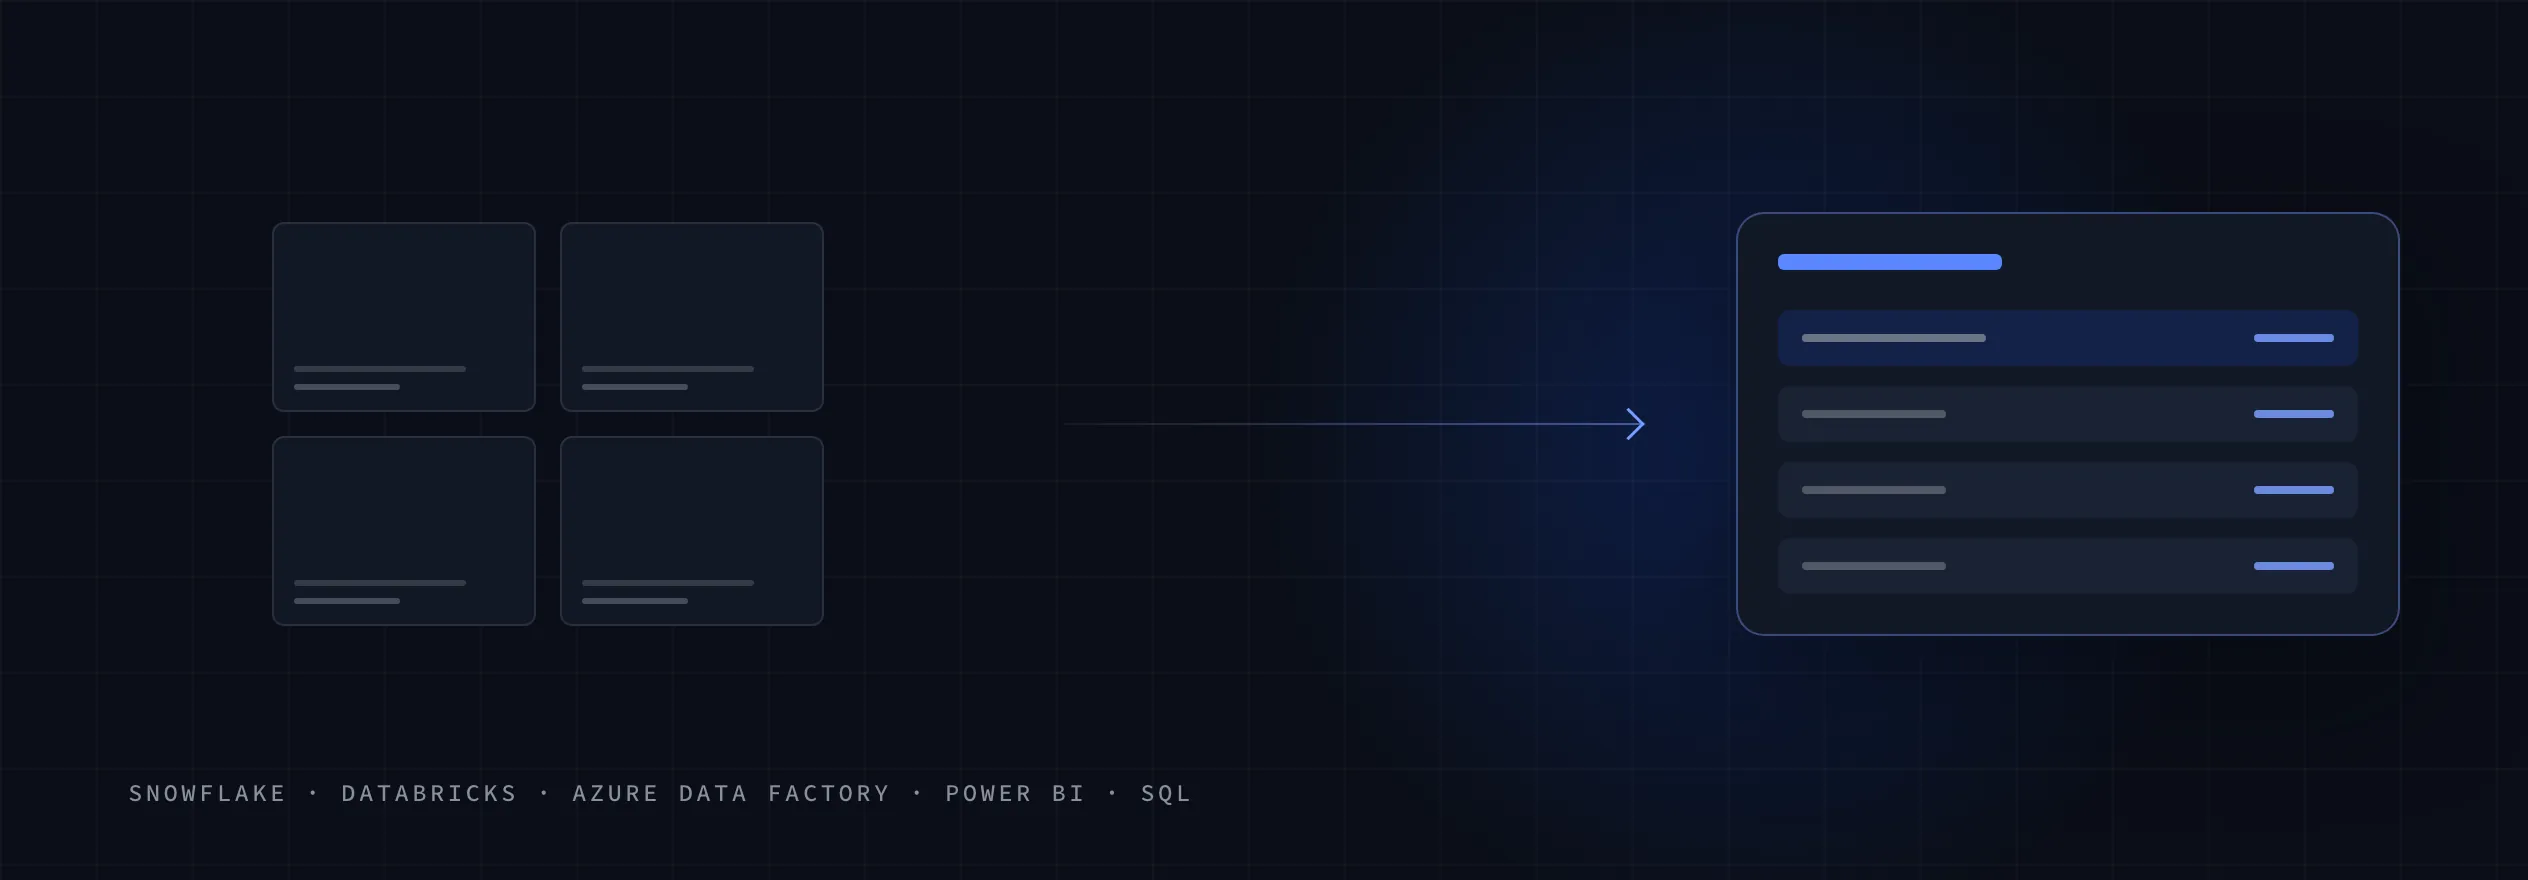
Customer data sat separately in each business unit, so nobody saw how customers used the product as a whole. We moved it into one Snowflake warehouse and built dashboards that show churn as it develops.

| Decision | Rejected alternative | Why |
|---|---|---|
| One cloud warehouse | Reporting per business unit | Customer behaviour can only be read across the whole business from one place. |
| Automated ETL pipelines | Exports gathered by hand | Loading every unit the same way keeps the warehouse current. |
| Churn as a monitored measure | Churn counted after the fact | A dashboard that shows it as it develops gives time to act. |
Internet and IT
An internet company of 50 to 250 people with subscription revenue, whose finance, product and customer teams each kept their own spreadsheets.
Retail
Foundation then Activation then Acceleration alongside StewardshipA retailer with Microsoft Fabric already in production, semantic models over Direct Lake and store revenue streaming in, who wanted forecasting, Copilot questions and anomaly detection on top of it.
Industrial manufacturing
Foundation then Activation then AccelerationAn industrial manufacturer reporting across a production network of sites, each with its own view of what was running.
Hospitality and real estate
Foundation then ActivationA holding group across hospitality and real estate, with entities that each closed their own books and a CFO who had to answer for all of them.
Free consultation
A free 60-minute consultation. No pitch, no invoice. You’ll leave knowing whether your data is ready for AI, and whether we’re a good fit.
Book your free consultation(opens in a new tab)