One set of subscription metrics for finance, product and customer teams
Internet and IT
An internet company whose finance, product and customer teams each reported from their own spreadsheets. All 3 now read one governed Power BI model with a shared subscription and revenue KPI layer.
Finance, product and customer teams each kept their own spreadsheets. We built the client’s first governed Power BI environment on one model of billing, CRM and product usage.
source systems in one model
3
teams reading it
3
subscription KPI families
4
months of engagement
19
No outcome figures are published for this engagement: nothing exists that would let you check them, so what was built is described in full instead. Anonymised by sector and size, because the confidentiality that protects this client would protect you too. Sector and outcomes are real; identifying detail is not.
Before and after
3 sets of spreadsheets
Finance spreadsheetsTheir own reading of revenue
Product spreadsheetsBuilt separately, prepared by hand
Customer spreadsheetsA third count of the same accounts
One model
One semantic modelBilling, CRM and product usage combined
Power BI for all 3 teamsThe same definitions in every report
From 3 teams reporting from their own spreadsheets to one governed model they all read.
The engagement in full
Client
An internet company of 50 to 250 people with subscription revenue.
Situation
Each team had its own reading of revenue, prepared by hand, so recurring revenue meant one thing in finance and another in product, and no conversation could start from an agreed number.
Mandate
Replace separate spreadsheet reporting with one governed Power BI environment and one definition of each subscription metric.
The subscription KPI layer
Recurring revenue, cohort retention, expansion and contraction are each defined once in the model, with standardised time intelligence, so finance, product and customer teams read the same figure for the same period. Cohort retention reads as one row per starting group and one column per period since.
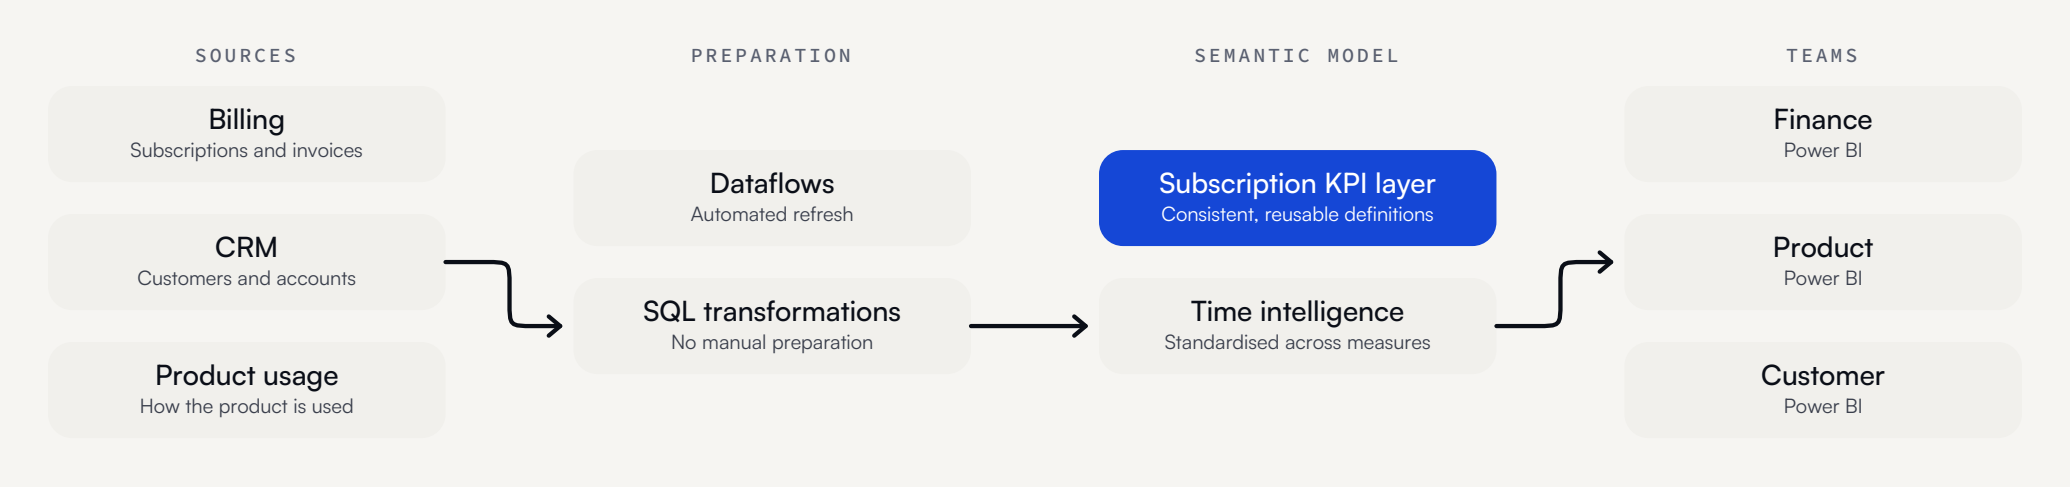
Refresh and delivery, automated
Preparation that used to precede every report now runs on its own.
SourcesBilling, CRM, usage
DataflowsScheduled refresh
SQLShaped for the model
ReportsPrepared automatically
The architecture
Billing, CRM and product usage are prepared automatically and combined in one semantic model, which all 3 teams read.
Architecture decisions
Decision
Rejected alternative
Why
One model across billing, CRM and usage
A model per team
All 3 teams read the same customers and revenue.
Definitions in a KPI layer
Formulas in each spreadsheet
Recurring revenue means one thing wherever it appears.
Workspace, naming and role-based access set up first
Access granted case by case
The environment stays governed as it grows.
What the client has today
A first governed Power BI environment, with role-based access, naming rules and user training.
One semantic model of billing, CRM and product usage, with reusable definitions.
Where it left them
3 teams answer subscription questions from one model, with one definition of each metric.
A retailer with Microsoft Fabric already in production, semantic models over Direct Lake and store revenue streaming in, who wanted forecasting, Copilot questions and anomaly detection on top of it.